Context Graphs: The Three Graph Structures Behind Reliable AI Agents
Synalinks Team
Context Graphs: The Three Graph Structures Behind Reliable AI Agents
When an AI agent answers a question, what actually happens behind the scenes? In most systems, the answer is: a language model reads some retrieved text and guesses. There's no structure. No trace. No way to verify the reasoning.
Synalinks takes a different approach. Instead of relying on probabilistic generation, it uses three distinct graph structures that work together to produce answers that are structured, traceable, and repeatable. We call this combination a context graph.
Each graph handles a different job:
- Directed acyclic graphs (DAGs) encode the logic rules that extract, structure, and reason over your data
- Knowledge graphs are the output of those rules: the structured facts and relationships that the DAG has derived
- Dependency graphs track the provenance of every answer back to its sources
Understanding how these three layers interact is key to understanding why deterministic reasoning works and why it produces fundamentally different results than RAG.
Directed acyclic graphs: the engine that builds knowledge
Everything starts with the DAG. In Synalinks, a DAG is a graph of logic rules where each rule depends on other rules or on raw data, with no circular dependencies. The "directed" part means rules flow in one direction, from inputs to conclusions. The "acyclic" part means no rule can depend on itself, directly or indirectly. This guarantees that evaluation always terminates and produces a definite result.
The DAG contains two categories of logic. Concepts extract and reformat data without calculating anything: they structure raw data into typed entities and relationships. Rules perform analytics and reasoning over those concepts to derive new knowledge. In both cases, the building blocks are Node definitions (entities) and Edge definitions (relationships). All of them live in the same DAG, evaluated in dependency order.
This is what makes Synalinks fundamentally different from systems that treat extraction and reasoning as separate steps. The same rule engine that turns your raw appointments table into structured patient-doctor relationships also determines which patients have the highest visit frequency. It's rules all the way down.
A practical example
Suppose you're building an AI agent to analyze your healthcare system. You connect your database to Synalinks Memory and define concepts and rules in the same DAG:
Concepts extract and reformat your raw data without any calculation. A PatientNode concept maps rows from your patients table into Patient entities with typed properties like patient ID, name, and date of birth. A DoctorNode concept does the same for doctors. A TreatmentNode concept structures medical treatment data. On the relationship side, a HasAppointmentEdge concept links patients to their doctors by joining PatientNode, DoctorNode, and the raw Appointments table, applying conjunction, deduplication, and ordering to produce clean, structured appointment relationships. A PrescriptionEdge concept connects treatments to patients. A DepartmentEdge concept tracks which doctors belong to which departments.
Rules perform analytics and reasoning over those concepts. One rule analyzes appointment patterns to identify the most frequent patients across the system. Another calculates department appointment load to understand resource distribution. A final rule combines appointment frequency, prescription history, and doctor assignments to surface doctor workload insights, complete with patient counts and specific metrics.
All of these, concepts and rules, nodes and edges, form a single DAG. Raw database tables flow into concepts that produce structured entities and relationships, which flow into rules that produce derived conclusions like frequent patient analysis and doctor workload metrics. Extraction and reasoning in one unified pipeline. No separate ETL step. No hand-wired data transformations. The DAG defines the entire flow from raw data to derived conclusions.
Knowledge graphs: the output of the rules
The knowledge graph isn't something you build separately. It's what the DAG produces. Concepts generate the structured entities (nodes) and relationships (edges). Rules derive higher-level conclusions from them. That accumulated result is the knowledge graph.
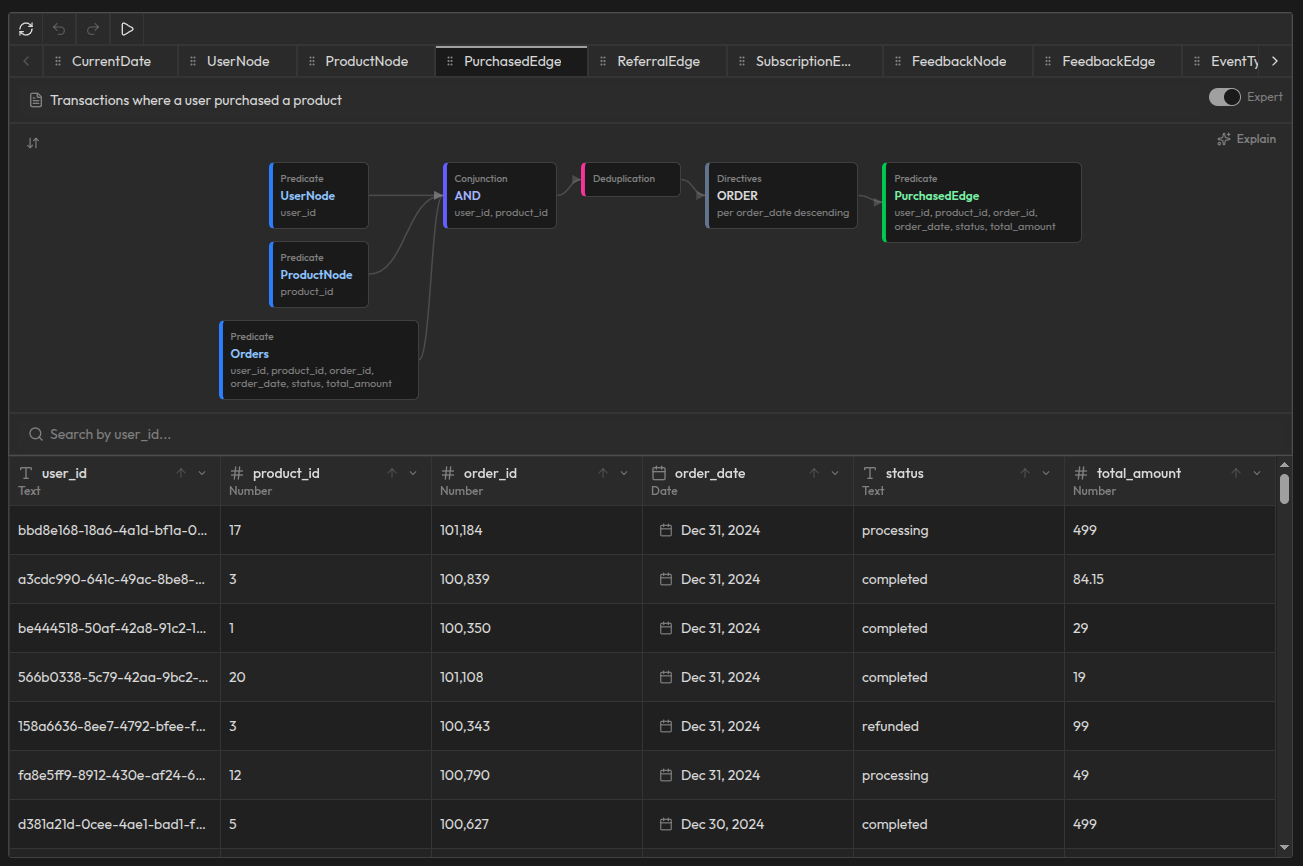
Take the HasTreatmentEdge concept as an example. It takes two inputs (PatientNode and TreatmentNode), joins them on patient ID and treatment ID, deduplicates the results, and orders them by date. The output is a clean, structured relationship: which patient received which treatment, when, and with what details. Each row in the result is a typed, verified edge in the knowledge graph.
The same pattern applies to every concept. DoctorNode structures raw doctor data into typed entities. HasAppointmentEdge connects patients to doctors through appointment relationships. PrescriptionEdge tracks prescriptions over time. Each concept produces nodes or edges that accumulate into the knowledge graph.
From the rules, the DAG derives higher-level conclusions: this patient has an unusually high appointment frequency. That doctor's workload exceeds department averages. These departments need more resources based on the combination of appointment patterns, prescription volumes, and patient distribution.
All of these, concept-produced nodes and edges plus rule-derived facts, form the knowledge graph. Entities like patients, doctors, and treatments have typed properties. Relationships like "patient has treatment" are explicit edges with dates and details, not inferred by a language model. Derived facts like "patient is a frequent visitor" sit alongside base facts, all queryable in the same way.
This is different from traditional knowledge graph approaches where you manually model an ontology and then populate it. In Synalinks, the DAG concepts and rules are the ontology. They define what entities exist, what properties they have, and what derived knowledge is meaningful. The knowledge graph is a living output that updates whenever the underlying data or rules change.
Why this matters
In a RAG system, "patient X received treatment Y" is just a sentence fragment floating in a vector space. In a knowledge graph produced by DAG concepts, it's a typed, structured edge: a specific patient, a specific treatment, with a date and details, with a clear derivation from a specific row in your Treatments table. You can query it, reason over it, and trace where it came from.
Dependency graphs: the provenance layer
Here's where most AI systems fall apart. Even if you get the right answer, you can't explain why it's right. You can't trace the reasoning. You can't audit it. And when the answer is wrong, you can't pinpoint what went wrong.
A dependency graph solves this by tracking the connections from source tables to concepts to rules. It records which tables provided the raw data, which concepts structured that data, and which rules reasoned over it to produce a conclusion.
Critically, concepts and rules are reusable. The same PatientNode concept that feeds into a frequent patient rule today can feed into a treatment outcome analysis tomorrow. The dependency graph tracks these connections over time, so you always know which sources feed which concepts, and which concepts feed which rules. When a source table changes, you can trace forward through the graph to see every concept and rule that's affected.
And because the reasoning is deterministic, the same inputs always produce the same outputs, the dependency graph isn't just a log. It's a genuine audit trail. You can replay any derivation chain and verify that the answer was correctly derived from the sources. This makes the entire system truly auditable, from source to answer.
A practical example
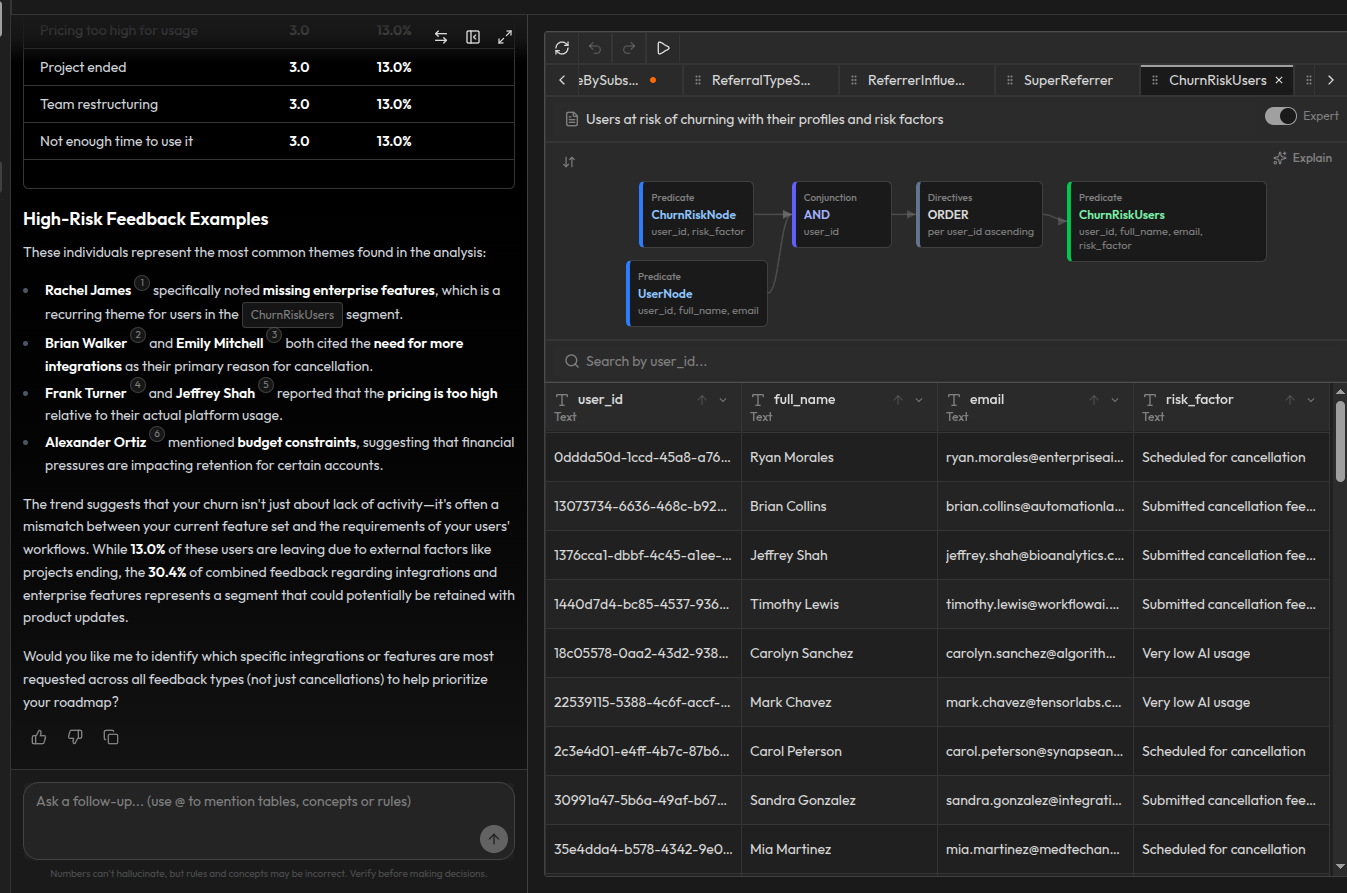
You ask: "Which patients have the highest appointment frequency?"
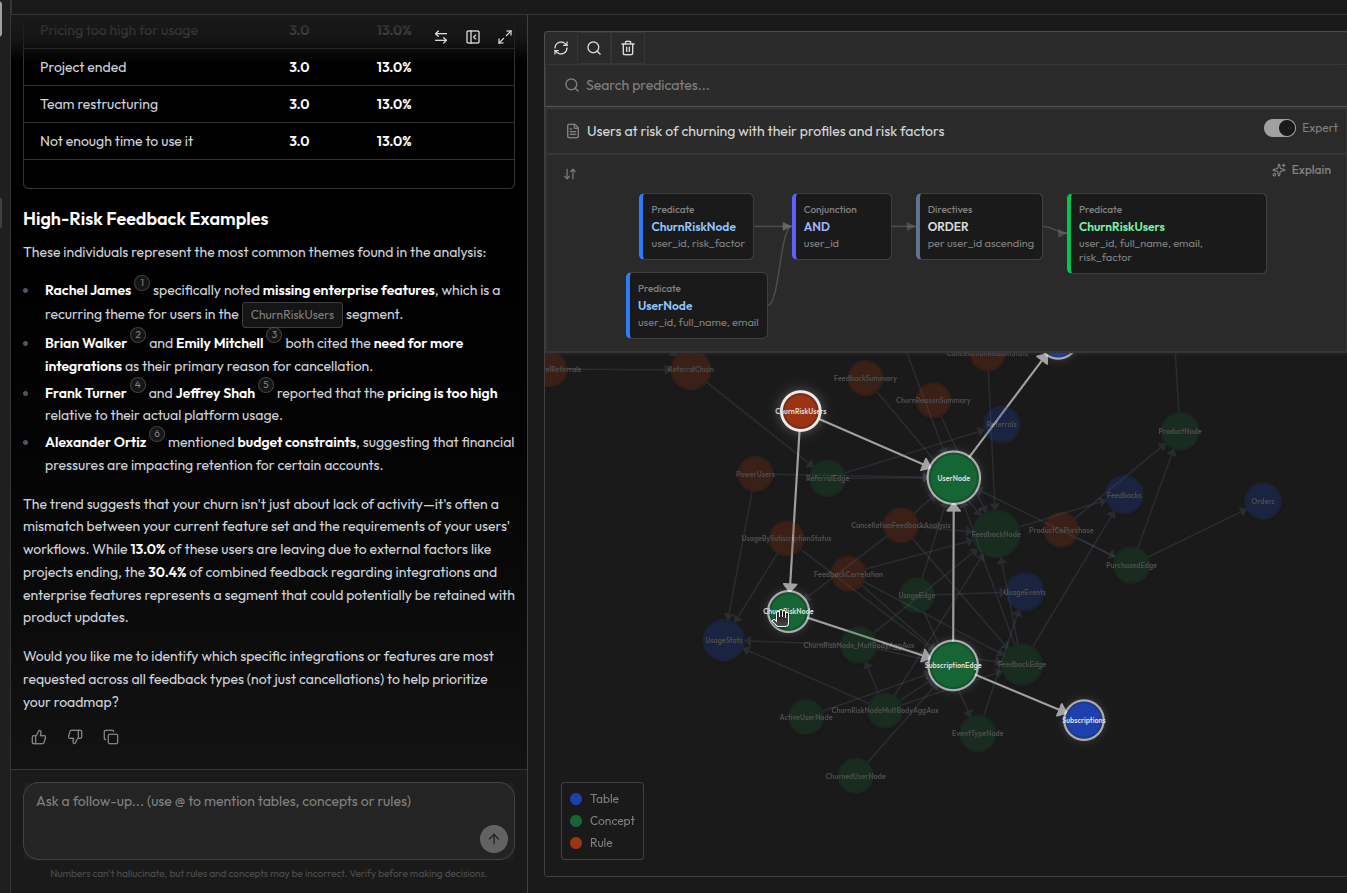
Synalinks returns a list of frequent patients with their profiles and specific metrics, along with the full dependency graph explaining how each patient was identified. The graph visualizes the complete reasoning chain from source to answer: each node represents a source table, a concept, or a rule, and the highlighted path traces exactly how the frequent patient conclusion was derived.
You can follow the chain: the raw patients table feeds into PatientNode, which feeds into HasAppointmentEdge, which connects to the doctor. The Appointments table feeds into HasAppointmentEdge through PatientNode and DoctorNode. Treatment data flows through HasTreatmentEdge. All of these converge into the frequent patient rule, which produces the final assessment.
Every level of the graph is a reusable building block. The PatientNode concept doesn't just exist for this one query. It's used wherever patient data is needed. The dependency graph records all these connections, so you can see not just how this answer was derived, but how changing a source table or modifying a concept would ripple through every rule that depends on it.
Because the reasoning is deterministic, this audit trail is fully reproducible. Same tables, same concepts, same rules, same answer. If the answer changes tomorrow, it's because the source data changed, and the dependency graph shows you exactly which table, which concept, and which rule was affected. This isn't a vague "these documents were retrieved" attribution. It's a verifiable, replayable derivation chain from source to answer.
How the three graphs work together
The three graph structures aren't separate systems. They're layers of the same process:
- The DAG defines the logic: concepts that extract and structure data into nodes and edges, and rules that perform analytics and reasoning over them
- The knowledge graph is the output: the accumulated structured facts and derived conclusions produced by evaluating the DAG
- The dependency graph is the audit trail: tracking the connections from source tables to reusable concepts to rules, making the entire chain reproducible and verifiable
When your AI agent queries Synalinks Memory, here's what happens:
- The DAG evaluates: concepts extract and structure data into nodes and edges, rules derive analytical conclusions
- The knowledge graph materializes: all the structured and derived facts become available
- The dependency graph captures the provenance: every step of the evaluation is recorded
The language model's job is reduced to presentation. It receives a structured, derived answer with full provenance and formats it for the user. It doesn't reason. It doesn't interpret. It communicates.
Why this matters for production AI
If you're running AI agents in production, you've probably experienced these problems:
"The agent gave different answers to the same question." Without structured reasoning, there's no guarantee of consistency. With a DAG of rules producing a knowledge graph, the same data always produces the same derived facts.
"We can't explain why the agent said that." Without provenance tracking, answers are opaque. With a dependency graph, every answer comes with a complete derivation chain from conclusion to raw source data.
"A data source changed and we don't know what's affected." Without dependency tracking, impact analysis is guesswork. With a dependency graph, you can trace forward from any raw data change through the DAG to see every derived fact that's affected.
"The agent hallucinated a relationship that doesn't exist." Without structured knowledge, the model invents connections between retrieved text chunks. With a knowledge graph built by explicit rules, relationships like "patient received treatment" only exist if a rule derived them from real data.
Context graphs address all of these by making the entire process, from raw data to structured knowledge to derived conclusions, structural, deterministic, and transparent.
Getting started
Synalinks Memory implements context graphs as a turnkey solution for AI agents. Connect your data sources, define your concepts and rules, and get structured, traceable answers with full provenance.
No embeddings. No vector search. No black-box reasoning. Just rules, graphs, and verifiable answers.
Screenshots are provided for illustration purposes. The final product may differ in some aspects. All data shown is synthetic and used for demonstration purposes only.